ACTIVE ETFs AND SMAs THRIVE AS MUTUAL FUNDS LOSE MORE GROUND
U.S. Distribution Pulse Quarterly | Q2 2024
U.S. Distribution Pulse Quarterly | Q2 2024

Time to Read: 5 minutes
Looking at Q1 positive net sales at wirehouses, two of the top three performers were mutual funds on rep-as-portfolio manager programs (multisector bond and intermediate core-plus bond). But in contrast to the fixed-income bounce back, U.S. equity mutual funds experienced deep outflows. As a result, mutual funds lost more of their overall share of wirehouse assets to both exchange-traded funds (ETFs) and separately managed accounts (SMAs).
U.S. small cap equity ETFs also saw significant inflows. Small value smart beta ETFs saw Q1 sales surpass their level for all of 2023, on models and rep driven. Meanwhile, small blend index sales outdid the last two years combined, mostly on models.
The upturn in flows comes despite small cap lagging far behind the S&P 500 in year-to-date performance. This may imply advisors are using small cap to diversify their risk or in the hope that mean reversion will add performance in H2.
ETF sales are becoming more diverse, with active ETFs winning a growing share of the market, while SMA flows were the highest in more than three years.
Figure 1: Top 10 Investment Styles Ranked by Percentage of Q1 2024 Positive Net Sales Wirehouse Fee-Based Advisory
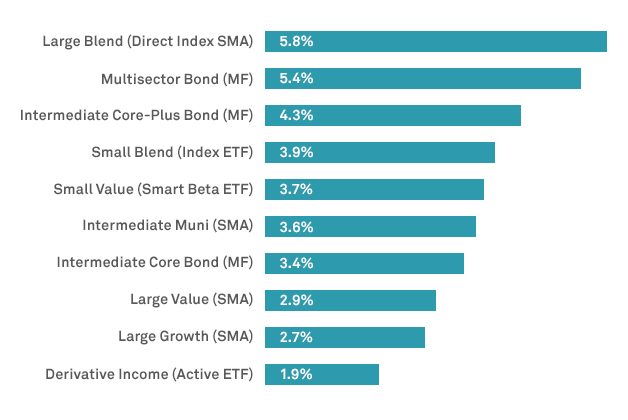
Source: BNY Growth Dynamics. Trend data as of December 31, 2023.
The ETF landscape is evolving. ETFs saw a decrease in flows during Q1, as expected following the impact of tax-loss harvesting on Q4 flows. Nonetheless, the data shows the highest first quarter inflows since 2022. Active ETFs also bucked the trend as they gained traction amid the outflows from U.S. equity mutual funds. While active ETFs account for only 5% of assets under management (AUMs), they were the source of 34% of Q1 ETF sales, according to BNY Growth Dynamics℠ data.
While the active ETF market was incubated in fixed income, the market shift towards growth in equities seen in recent years continued in Q1. Flow into active ETFs has also become much less concentrated, with the market experiencing a major shift between Q1 2021 and Q1 2024. The top 10 tickers represented exactly 50% of Q1 AUM, down from 64% in Q1 three years earlier.
This can potentially be attributed to greater choice in the market; not only have hundreds of active ETFs launched in recent years, but some now have three-year track records to support their quest for meaningful allocations. Some are starting to scale and the number of active ETFs meeting the ‘gatekeeping’ criteria to be available to wirehouse advisors is growing.
Active ETFs now have a three-year compound annual growth rate (CAGR) of 16%. Growth is being driven by models and rep-as-portfolio manager programs, with decreases on commission-based programs.
New opportunities are arising as distribution in this space becomes less concentrated on a few major players. Alternatives accounted for 46% of active ETF net sales from Q1 2021 to Q1 2024, followed by taxable fixed income (28%), U.S. equity (16%), international/global equity (5%) and muni fixed (4%).
Pershing’s registered investment advisor (RIA) data on active ETF net flows shows a similar trend of diversification. The top 10 tickers represented 37% of AUM in Q1 2024, falling from 56% in Q1 2021.
Looking at ETFs by management type, active ETFs’ market share has grown 1.2% since Q1 2022 to almost 4.9% versus 66.2% for index and 28.9% for smart Beta.
Figure 2: Wirehouse — Active ETF Net Flows
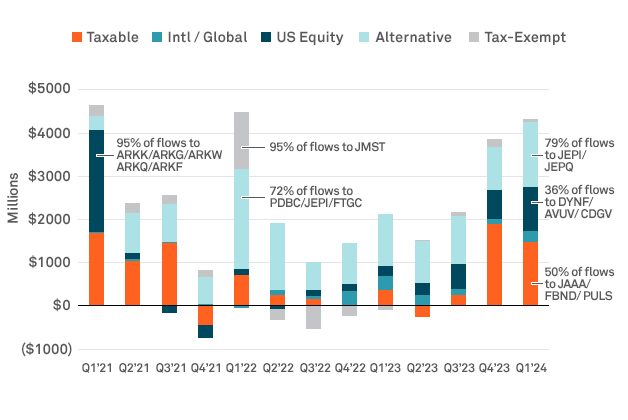
Source: BNY Growth Dynamics. Trend data as of December 31, 2023.
Both ETFs and SMAs continued to take share from mutual funds across wirehouse programs. Our data on wirehouse assets by investment vehicle shows that mutual funds accounted for 48% of assets in Q2 2022. But that fell to just 42% in Q1 2024, a dramatic decline for such a brief time scale.
Commission-based and rep-as-portfolio manager outflows have continued to drive down mutual fund assets. ETFs now account for 34% of wirehouse assets, up from 31% in Q2 2022, and SMAs represent 24% of the total, up from 21%.
Q1 saw the highest SMA flows in more than three years, with significant sales across direct index U.S. equity, taxable and muni fixed income. Direct index SMA has achieved an impressive two-year CAGR of 48%.
Figure 3: Netflows by Asset Class Q1 2024 — Wirehouse Fee Based Advisory

U.S. equity SMAs were a major driver of Q1 flows, with direct index accounting for 50% of positive U.S. equity SMA net sales. Taxable fixed income mutual funds were the other major source of flows, with sales hitting the highest level since Q2 2021.
Eaton Vance Parametric accounted for 72% of direct index AUMs, continuing to dominate. But all five major players saw impressive sales spikes in Q1, leaving little or no space for a more diverse direct index landscape. Collectively, the five accounted for 99.9% of assets and sales. Goldman Sachs, BlackRock and PGIM have all punched above their weight class, with sales outstripping their asset share percentages.
Please reach out to the Growth Dynamics team who can help you use this market data to uncover opportunities and achieve deeper engagement with financial advisors.
1 According to Morningstar data for Q1 2024.
Disclaimer
BNY, BNY Mellon and Bank of New York Mellon are corporate brands of The Bank of New York Mellon Corporation and may be used to reference the corporation as a whole and/or its various subsidiaries generally. This material does not constitute a recommendation by BNY of any kind. The information herein is not intended to provide tax, legal, investment, accounting, financial or other professional advice on any matter, and should not be used or relied upon as such. The views expressed within this material are those of the contributors and not necessarily those of BNY. BNY has not independently verified the information contained in this material and makes no representation as to the accuracy, completeness, timeliness, merchantability or fitness for a specific purpose of the information provided in this material. BNY assumes no direct or consequential liability for any errors in or reliance upon this material.
This material may not be reproduced or disseminated in any form without the express prior written permission of BNY. BNY will not be responsible for updating any information contained within this material and opinions and information contained herein are subject to change without notice. Trademarks, service marks, logos and other intellectual property marks belong to their respective owners.
©2024 The Bank of New York Mellon. All rights reserved. Member FDIC.

Banks must strike a careful balance between helping to fuel economic activity with loans and keeping their balance sheets on solid ground.

BNY Mellon Growth Dynamics data shows flow trends to U.S. equity ETFs in the second half of 2023 began to shift, leading to the highest U.S. equity flows in Q4 2023 since the end of 2021.

BNY Mellon Growth Dynamics data shows a continued rebound of fund flows into equity exchange-traded funds and separately managed accounts while mutual funds continue to see outflows.

Explore the recent amendments to the ELTIF regulation and its impact on European long-term investment alternative investment funds, and retail investors.